Due on Wednesday June 11 at 11:59 PM
Policy on open resources and collaboration
This policy is meant to provide clearer guidelines regarding what is/is not acceptable.
As with other assignments in this class, this final is open note, communication, internet, etc.
You may refer to lecture/workshop materials to get started on writing or coding.
However, you may only communicate with classmates or use AI tools (e.g. ChatGPT) after you have tried to write code or text on your own.
For example, you may compare answers with classmates and talk through your reasoning after you have thought and written about your answers independently (there are plenty of examples from lecture of how we do this: typically, we think and write on our own, then compare answers with neighbors).
Additionally, you may only use ChatGPT or other tools for coding after you have tried to write code independently. An acceptable prompt could be something like, “I wrote this code to read in my data, but it’s not working. How can I fix this?” not “Write code for me to read in my data.”
Further, any use of ChatGPT or other tools like Grammarly may not be used for generating new writing. An acceptable prompt could be something like, “I wrote this text to summarize a paired t-test. Edit it to be 1-2 sentences long.” not “Write me a 1-2 sentence template to summarize a paired t-test.”
Lastly, a warning: Think critically and double check your work at every step. Do not assume that answers given by ChatGPT (or your classmates, or from any other source) are right and/or fit the criteria for what you are being asked to do.
Getting help from the instructional team
As usual, you are welcome to come to drop-in hours, email for meetings, etc.
If you are working with classmates (which we encourage you to do!), you are welcome to try to make a group meeting (i.e. you and some friends get helped together) with An. You and your peers can email An to set up a meeting time (that works for all of you) to answer questions outside of drop-ins.
Set up
a. GitHub steps
- Name the repo
ENVS-193DS_spring-2025_final, write a description, initialize with a README.
b. RStudio steps
- Clone the repository to your computer.
- Create a
codeand adatafolder. - Start a new Quarto or Rmarkdown document in the
codefolder. - Download any data you need into your
datafolder. - Insert a link to your GitHub repo at the top of your document.
- In your new Quarto document, create a code chunk at the top to read in any packages or data.
- Throughout the course of completing this portion of the final, commit and push changes at least 10 times.
- Write a README with a “General information” section, “Data and file overview” section, and a “Rendered output” section.
- Link to the rendered .html in your “Rendered output” section.
Problem 1. Research writing (36 points)
Skills you will demonstrate
In this problem, you will demonstrate your ability to identify gaps in statistical communication and justify why those gaps should be filled.
Additionally, you will demonstrate your ability to write about statistics without a complete analysis or the information you would need.
Problem
You’re working on a research team trying to understand how agricultural runoff in the San Joaquin River Delta influences total nitrogen load (measured in kilograms per year, kg year-1). Your co-worker runs some analyses and writes up a report, giving it to you to review. In part 1 of the results section of the report, your co-worker has written:
We rejected the null hypothesis that there is no correlation between distance from headwater (km) and annual total nitrogen load (kg year-1) (p = 0.03).
In part 2 of the results section of the report, your co-worker has written:
We rejected the null hypothesis that there is no difference in average nitrogen load (kg year-1) between sources (urban land, atmospheric deposition, fertilizer, wastewater treatment, and grasslands) (p = 0.02).
It’s great that this report is coming together, but you think they can improve on what they’ve written and make it more understandable to a non-statistical audience.
a. Transparent statistical methods (8 points)
What statistical tests did your co-worker use? Clearly connect the test to the part that you are addressing (e.g. “In part 1, they used _______. In part 2, they used _______.”).
b. More information needed (8 points)
The test in part 2 seems familiar to you, but you think there’s more that your co-worker needs to do to provide more context for the results. List 2 additional tests and/or pieces of information that should be included, and explain why those tests and/or pieces of information would add useful additional context.
Be specific and use variables and/or statistics from the example.
c. Suggestions for rewriting (20 points)
In 1-3 sentences, write new research statements to include relevant components from parts a-b and a full test summary in parentheses to be transparent about the statistical method.
Be sure that your rewritten statements clearly delineate the biological narrative from the statistical summary. See lecture and workshop for examples of writing.
Note that your co-worker didn’t include any information about the test statistic, distribution, etc., and that you only know the p-value. For any part that you do not know, list that part with text. For example, you could write something like: “… r = correlation coefficient, p = 0.03, \(\alpha\) = significance level …”
This problem is inspired by a publication outlining the very real consequences for river ecosystems from nitrogen and phosphorus addition to the San Joaquin and Sacramento rivers:
Saleh, Dina and Joseph Domagalski. 2021. “Concentrations, Loads, and Associated Trends of Nutrients Entering the Sacramento–San Joaquin Delta, California.” San Francisco Estuary and Watershed Science. DOI: 10.15447/sfews.2021v19iss4art6.
Problem 2. Data visualization (36 points)
Skills you will demonstrate
In this problem, you will demonstrate your ability to find, clean, summarize, and visualize a data set. You will use data from the Santa Barbara Coastal LTER on sea surface temperature in the Santa Barbara Channel.
Note that the instructions do not include all the steps you need to do on purpose. You will need to use your skills in working backwards from a final product (the visualization given to you) to determine the steps to get there.
Problem
Navigate to the SBC LTER’s data catalog. Find and download the dataset on sea surface temperature in the Santa Barbara Channel to your data folder. (Hint: the page on the data catalog is called “Sea Surface Temperature in SB channel”.)
In your set up chunk, read in the data as an object called sst.
a. Cleaning and summarizing (16 points)
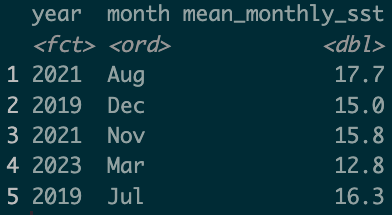
Create an object called sst_clean from sst. Clean and summarize the data such that you end up with a data frame like this:
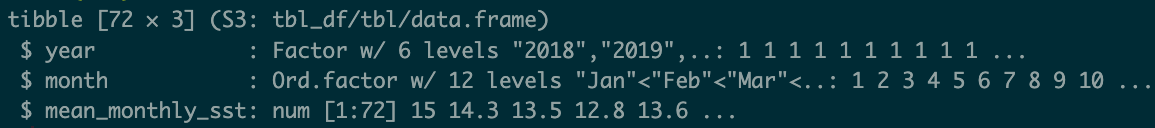
with a structure like this:
Use the pipe operator (|> or %>%) to string functions together. After every pipe, start a new line to use the next function. Include annotations for each function you use.
When you are done with all your cleaning steps, display 5 rows from sst_clean using slice_sample() and the structure using str().
Show all code.
lubridate package.
You may find it useful to use functions from the lubridate package (pre-loaded in tidyverse, so you don’t have to install/read it in separately).
Not sure where to start? Google the package and read about it.
When writing your cleaning and summarizing code, run your code after adding each function. Does your data frame look the way you’d expect?
Additionally, pay attention to the components in the figure. What has to be true about your data frame in order for you to recreate this figure? (Hint: think about what years are displayed in the figure, and contrast that with the years in the data set.)
b. Visualize the data (20 points)
Recreate this visualization:
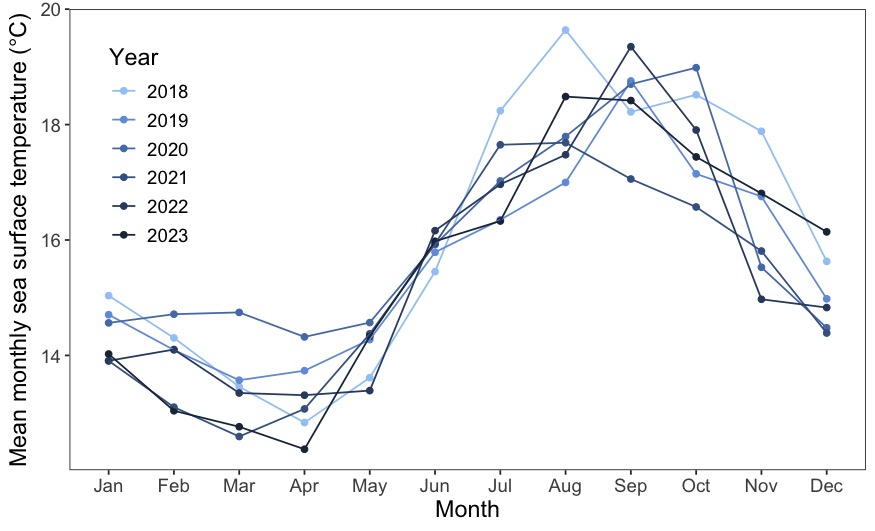
In addition to displaying the correct subset of the data, the specific aesthetic components you need to recreate are:
- the geometries (there are two)
- the x-, y-axis, and legend text and labels
- a color gradient in a single color (doesn’t have to be blue, can be any other color) going from light –> dark for 2018 –> 2023
- the legend position inside the panel
- the panel border and background
Problem 3. Data analysis (87 points)
Skills you will demonstrate
In this problem, you will demonstrate your ability to understand a data set that someone else collected and identify and execute the appropriate statistical method, with all assumption checks. Additionally, you will demonstrate your ability to visualize and communicate about the results of your statistical test.
You will be working with the nest box occupancy dataset from Stojanovic, D., Owens, G., Young, C.M., Alves, F. and Heinsohn, R. 2021. “Do nest boxes breed the target species or its competitors? A case study of a critically endangered bird.” Restoration Ecology. DOI: 10.1111/rec.13319
The data citation is: Stojanovic, Dejan et al. (2021). Do nest boxes breed the target species or its competitors? A case study of a critically endangered bird [Dataset]. Dryad. https://doi.org/10.5061/dryad.83bk3j9sb
You will answer the following research questions:
- How do year (2016 or 2019) and distance from forest edge predict Swift Parrot (Lathamus discolor) nest box occupancy?
- Is there a simpler model that explains Swift Parrot nest box occupancy, and if so, what is it?
READ THE INTRODUCTION AND METHODS BEFORE YOU START.
Problem
Read in your data in the set up chunk, storing it as a new object called nest_boxes.
Do any exploring you need to do (exploratory visualizations, etc.) but DO NOT include any code or output from your data exploration.
Note that you may have some cleaning/wrangling steps to do. Do them before running your models!
Not sure how to write code but hide it and/or its output from the final rendered document? Check here for options.
a. Response variable (2 points)
In 1-2 sentences, explain what the 1s and 0s mean in this data set biologically.
b. Purpose of study (2 points)
The authors compare nest box occupancy between 3 species: Swift Parrots, Common Starlings, and Tree Martins. In 1-2 sentences, explain the main difference between Swift Parrots and the other two species in the context of this study.
c. Difference in “seasons” (2 points)
The authors compare two years (that they refer to as “seasons”). In 1-2 sentences, define what those years/seasons are, and explain how they differ in the context of this study.
d. Table of models (10 points)
Make a table of all the models you will need to run. You will run 4 models: a null model, a saturated model, and two other models with different combinations of predictors.
Stuck on how to create a table? See workshop 8 for an example.
Your table should have 4 columns: (1) model number, (2) season, (3) distance to forest edge, and (4) model description.
e. Run the models (8 points)
Write your code to run all your models. Do not display any output.
f. Check the diagnostics (6 points)
Check your diagnostics for all models using simulated residuals from the DHARMa package.
Display the diagnostic plots for each model.
g. Select the best model (6 points)
Using Akaike’s Information Criterion (AIC) from the MuMIn package, choose the best model.
In text, write what the best model was (i.e. “The best model as determined by Akaike’s Information Criterion (AIC)…”).
Use the predictors and the response variable to describe the model, not the model number that you assigned.
h. Visualize the model predictions (24 points)
Create a plot showing model predictions with 95% confidence intervals and the underlying data.
Show and annotate all code. Show the output.
For full credit:
- make sure the x- and y-axis labels are written in full
- take out the gridlines
- use colors that are different from the default
i. Write a caption for your figure. (7 points)
Include a figure number, title, description of the figure, and data citation.
j. Calculate model predictions (4 points)
Calculate the predicted probabilities of Swift Parrot nest box occupancy with 95% at 0 m from forest edge and 900 m from forest edge for each level in season.
Show and annotate all code. Display the output.
k. Interpret your results (16 points)
Write 3-5 sentences summarizing what you found, making references to the figure you made in part h and the predictions you calculated in part j. Your summary should include your interpretation of:
- the predicted probability of occupancy at the forest edge (0 m) and farther away from the forest edge (900 m) between seasons
- the relationship between distance from forest edge and probability of occupancy
- the biology behind the trends you found - what explains the relationship between distance from forest edge and probability of Swift Parrot nest box occupancy?
To understand the biology behind the trends you found, you need to read the paper and look at the figures. For which species do you see the opposite relationship between distance to forest edge and probability of occupancy?
Problem 4. Affective and exploratory visualizations (45 points)
Skills you will demonstrate
In this problem, you will demonstrate your ability to communicate about your visualization and give feedback to others. You will also demonstrate your ability to design and execute an appropriate statistical analysis for your data.
Problem
a. Comparing visualizations (20 points)
Compare and contrast your affective visualization from Homework 3 and the exploratory visualizations you made for Homework 2. In 1-3 sentences each, explain:
- How are the visualizations different from each other in the way you have represented your data?
- What similarities do you see between all your visualizations?
- What patterns (e.g. differences in means/counts/proportions/medians, trends through time, relationships between variables) do you see in each visualization? Are these different between visualizations? If so, why? If not, why not?
- What kinds of feedback did you get during week 9 in workshop or from the instructors? How did you implement or try those suggestions? If you tried and kept those suggestions, explain how and why; if not, explain why not.
b. Sharing your affective visualization (25 points)
This is a component you will complete in workshop during week 10. We will be taking attendance that day. If you attend class and complete the activity, you will receive full credit for this section.
Double check your assignment!
On Canvas, you will submit two links:
- the link to your GitHub repository (15 points)
- the link to your rendered html (15 points)
Your GitHub repository should:
Your rendered html should:
Additionally, your rendered html should include only the components listed below:
for Problem 1:
for Problem 2:
for Problem 3:
for Problem 4:
Lastly, check out the rubric on Canvas to see the point breakdown in more detail.
310 total points